ACADEMIC SUPPORT · GCC RESEARCHERS
Confirmatory Factor Analysis Results: Read Model Fit Without a Magic Cutoff
Interpret the measurement model, report the full evidence and explain why a single threshold cannot approve a dissertation.
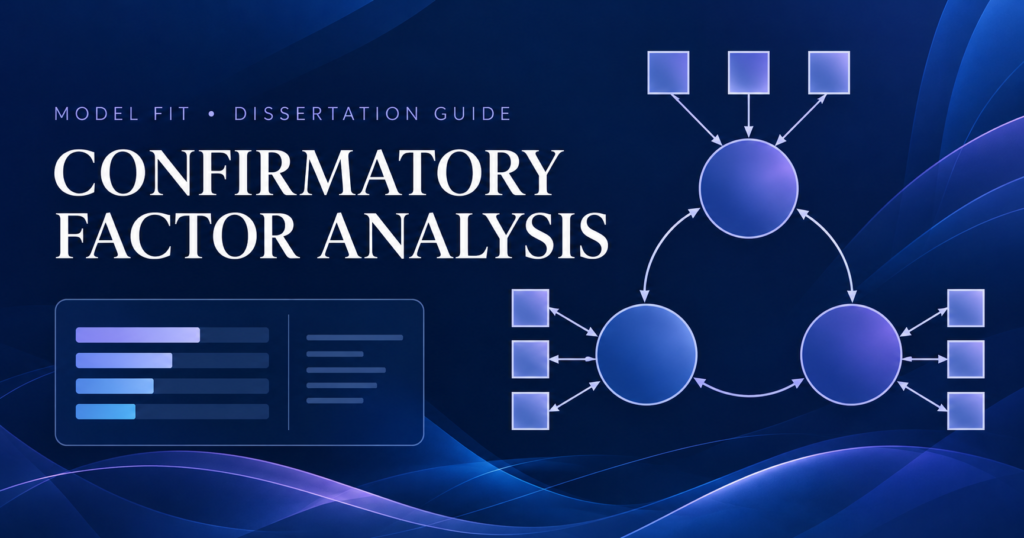
Confirmatory factor analysis (CFA) tests a measurement structure specified before seeing the results. Read model fit as a set of evidence: the theory and item-to-factor map, estimator and data conditions, chi-square and degrees of freedom, complementary fit indices, parameter estimates and residuals. A familiar CFI or RMSEA cutoff is a reference point, not a universal pass mark. Report the model you tested, the full output and any justified changes so a reader can evaluate the conclusion.
This guide addresses the interpret-and-report stage. If you have not yet decided whether your question calls for an exploratory or confirmatory approach, start with Labeeb’s EFA versus CFA decision guide. If you are choosing software, the SPSS, AMOS and SmartPLS comparison serves a different decision. None of these guides substitutes for your supervisor’s method approval.
Begin with the model, not the score
Before interpreting fit, write down which observed items indicate each latent factor and why. Note the source of the instrument, response scale, study population, hypothesised factor correlations and any constraints. CFA is meaningful only relative to that specified model. A favourable index does not show that every item is valid, that the scale works identically in every language, or that a proposed causal relationship is true.
Question 1: What was specified?
Keep a diagram or item-to-factor table dated before interpretation. Show whether cross-loadings and correlated errors were specified or fixed.
Question 2: What data were analysed?
State the analysed sample, missing-data handling, item type and estimator. These choices can affect the fit indices and standard errors.
Question 3: What does the output support?
Read global fit alongside loadings, residuals, uncertainty and theoretical coherence rather than selecting one attractive number.
For a multi-country or Arabic–English instrument, document translation and administration decisions separately. Acceptable fit in one sample is not, by itself, evidence of equivalence across language or country groups. If cross-group comparisons are central, plan an appropriate measurement-invariance assessment with your methods adviser.
Read the common fit statistics together
The table is an interpretation map, not a list of compulsory cutoffs. Methodological reviews warn that fixed thresholds can mislead when model size, estimator, sample and misspecification differ from the simulations that produced them. Use the conventions required by your field or institution, explain their limits, and show the actual values.
| Output | What it helps assess | What it cannot establish alone |
|---|---|---|
| Chi-square, degrees of freedom and p value | Discrepancy between the model-implied and observed relationships under an exact-fit test. | Whether the model is useful or valid; the test can react to sample size and small deviations. |
| CFI and TLI | Improvement over a baseline comparison model, with different adjustments. | That every loading is sensible or that one fixed cutoff applies to every model. |
| RMSEA with confidence interval | Approximate misfit per degree of freedom and uncertainty around that estimate. | A context-free verdict, especially in small or low-degree-of-freedom models. |
| SRMR | Average standardised residual discrepancy. | That local areas of misfit or substantively weak items are absent. |
The review of CFA fit evaluation and a large simulation on fixed cutoffs explain why interpretation must be model-sensitive. A separate ethics paper on fit-index use warns against selective reporting. Do not hide an unfavourable statistic simply because another index looks good.
Worked example: a plausible but incomplete fit story
Imagine a fictional dissertation testing a three-factor survey of service trust, perceived clarity and intention to enquire. The proposal specifies four items for each factor. The first model produces a seemingly favourable comparative index but one clarity item has a weak, uncertain loading; a cluster of residuals suggests two similarly worded items share something beyond the factor. Those observations are questions to investigate, not permission to delete items until a threshold turns green.
| Weak report | Defensible report pattern |
|---|---|
| “CFA passed because CFI exceeded the cutoff.” | “The prespecified three-factor model was estimated on the stated sample with the stated estimator. We report chi-square/df, CFI, TLI, RMSEA with interval and SRMR, then inspect standardised loadings, residuals and factor correlations.” |
| “We deleted two items to improve fit.” | “We investigated two items for a documented wording or construct reason. The change is identified as post hoc, compared with the original model and discussed as requiring replication.” |
| “The scale is valid in all GCC markets.” | “The results support this specified structure in this sample subject to the reported limits; cross-market equivalence has not been tested.” |
These are fictional statements, not invented software output. The practical lesson is to separate a statistical summary from a substantive claim. Where an item performs poorly, inspect its wording, response distribution, translation, coding and theoretical role before changing the model. Preserve the original run and the reason for every revision.
Check the parameters and the parts of the model
Global fit can conceal local problems. Report standardised factor loadings and their uncertainty, factor correlations, any inadmissible estimates, and the pattern of residuals. A very high factor correlation may raise a discriminant-validity question; a negative variance or coefficient outside an admissible range requires investigation before interpretation. The scale-development primer places factor structure within a wider validation process that includes item quality and reliability evidence.
- Inspect data first. Check coding, reverse-scored items, missingness, sparse response categories and whether your estimator suits ordinal or continuous indicators.
- Review the prespecified model. Confirm the software used the factor map you intended. A diagram exported after fitting is not proof of a preplanned model.
- Read global and local evidence. Record all chosen fit statistics, intervals and loadings; review residuals and any warnings.
- Investigate with theory. If the model fits poorly, consider whether item wording, factor definition or sampling explains the pattern. Avoid automatic modification-index fishing.
- Document any revised model. Show the initial result, the rationale, the exact change and its limits. Cross-validation or a new sample may be needed before strong claims.
Method papers warn that repeatedly searching modifications on the same data can overfit the sample. A model that fits one dataset after many unreported trials can perform worse elsewhere. Your methods chapter should let another researcher reconstruct what was specified, what changed and why.
A reporting checklist for the methods and results chapters
Methods
State theory, instrument and item source; factor/item map; sample and recruitment; missing data; item scale; estimator and software/version; prespecified fit-evaluation approach.
Results
Give analysed N, model degrees of freedom, chi-square and chosen complementary indices, including intervals where appropriate; show loadings, uncertainty, factor correlations, residuals and warnings.
Interpretation
Explain fit as a judgement across evidence, state post hoc changes explicitly, identify population and language limits, and avoid claiming that CFA alone establishes causality.
The CFA reporting review criticises papers that omit full loading matrices. Your supervisor or journal may require additional items, and their instructions take precedence over this general checklist. Keep tables readable and label whether estimates are standardised or unstandardised.
Questions researchers commonly ask
What if CFI looks good but RMSEA does not?
Do not select the favourable index as the verdict. Check model degrees of freedom, sample conditions, estimator, confidence interval, residuals and the theory behind the measurement structure. Explain the disagreement, and seek qualified methods review where it affects your main conclusion.
Can I remove items to improve fit?
Only with a defensible construct or measurement reason, transparent reporting and a discussion of the resulting limitation. Repeated deletion driven solely by the desired score turns a confirmatory test into data-guided model search.
Does good CFA fit prove the questionnaire is valid?
No. It supports one aspect of structural evidence for the tested model and sample. Content, response processes, reliability, relationships with other variables and any cross-group equivalence may also matter for your intended use.
Sources checked: CFA fit-evaluation review; fixed-cutoff simulation; ethical reporting of fit indices; scale-validation primer. Apply current institution and journal requirements to your specific study.
Make the measurement argument understandable
If your CFA output is difficult to interpret, Labeeb can scope methodological support around your approved research question, item map and actual results. We can help you explain the evidence and reporting choices while you retain ownership of the data, analysis decisions and dissertation. Share your institution’s requirements and the output for a consultation.
 Rayyan Screening Workflow for a Systematic Review: Decisions and PRISMA Counts
 Exploratory Factor Analysis Results: Interpret Loadings, Rotation and Cross-Loadings
 Dissertation Data Analysis Plan: Map Questions to Variables and Tests
 Research Question vs Hypothesis: Choose and Align Your Dissertation